
Charts Only: 2014/2015 Bermuda Budget
For those seeking a quick visual view of the 2014 Budget delivered in the House of Assembly by Finance Minister Bob Richards this morning [Feb 21], the charts extracted from the Budget are below.
For comparison’s sake, charts from the 2013 Budget are here, the 2012 Budget are here, the 2011 Budget are here, and charts from the 2010 Budget are here.

Read More About
Category: All, News, Photos, Politics, Politics
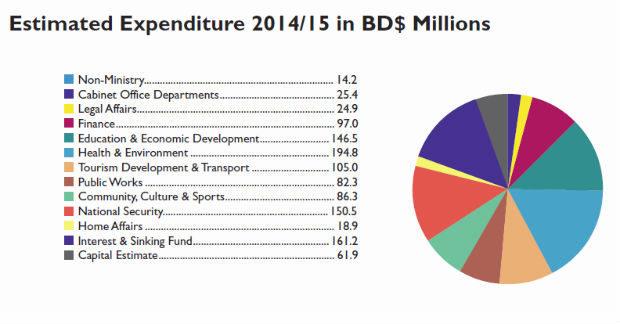
Wow. We now spend more on debt interest than we do on education and economic development.
If you wanna keep chirping about what a die-hard PLP supporter you are, fine by me. But if you are fair and honest, the least you can do is admit your moronic level of understanding when it comes to basic economics.
When will you ask your Government and your Minister of Finance about revenue generation and economic diversification? Or is that only for moronic PLP supporters like me who have no understanding of basic economics? Oh I forgot, the OBA/UPB’s economic theory is to kiss the azz of IB in the hope of some crumbs for our little local table. Perfectly put by your Minister of Finance today when he said proudly that exempt companies and local companies pay the same taxes; not recognizing that that is precisely the problem with this economy. Every work permit costs the same whether its for the CEO or the potwasher. Still think your team has it all figured out?
Nope definitely don’t think they have it all figured out.
But they still have more of a clue than ‘your team’ who has placed us in this financial quagmire with their irresponsible spending and lack of revenue raising.
Nope definitely don’t think they have it all figured out.
But they still have more of a clue than ‘your team’ who has placed us in this financial quagmire with their irresponsible spending and lack of revenue raising.
And the fact that you continue to disparage the one sector that provides the majority of government revenue shows me that like ‘your team’ you have absolutely no clue about our economy because if you did you wanted seek to push out the one income generator that provides government with much needed funds.
@Hmmmmm
You say “my team” as if you’re so sure I’m an OBA supporter. That’s a big–and incorrect–assumption on your part mate. I’m not “blindfaithful” (thanks for the word, Betty Trump!) to either party. Clearly that sort of “thinking” is what got us into this mess in the first place.
And that’s all I was commenting on. The level of debt and mismanagement over the past 5 – 10 years is staggering. Anyone who denies that is a bloody fool. I stand by that statement and my original post.
National security @150 Million expenditure? Am l reading this correctly?
Tourism at Over 100 Million?!
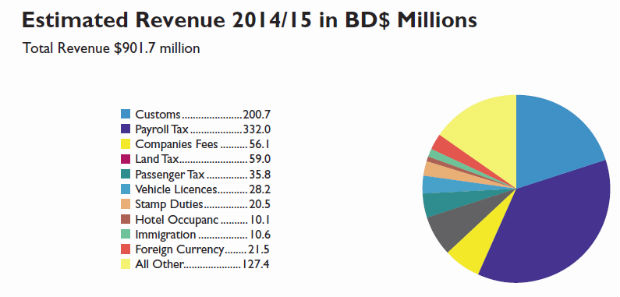
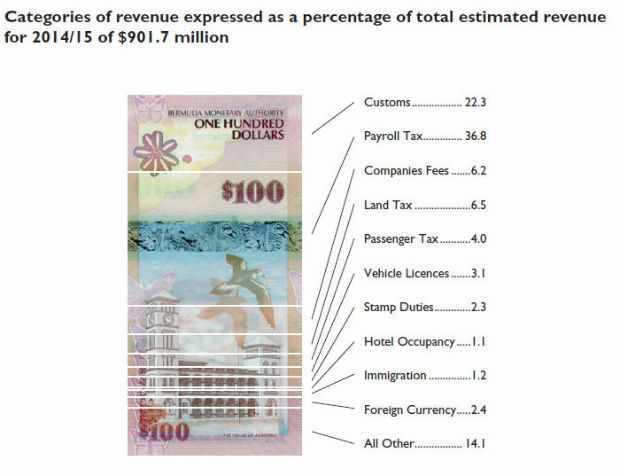
Yet our Foreign Currency is only 2.4 million and Hotel at 1.1 million in revenue?
This does not make sense….all the number don’t add up and its because the Bermudians are still living large with Government salary’s while everybody else pays for it.
Tourism & Transport – did you not read about a strike regarding the state of the ferry fleet?
Upkeep of buses and ferries is not just for tourists…
I agree with your sentiments regarding the Government salaries.
Your foreign currency and hotel numbers are percentages of total revenue.
The pie chart estimates $21.5m and $10.1m respectively (still quite small compared to the tourism spend and likely to suffer with union disputes).
Total Estimated Revenue $901 million, and to think that under the PLP Government they can’t find where $800 million in unaccounted for dollars went.
Land tax higher than company fees?
Thanks for compiling this for us!
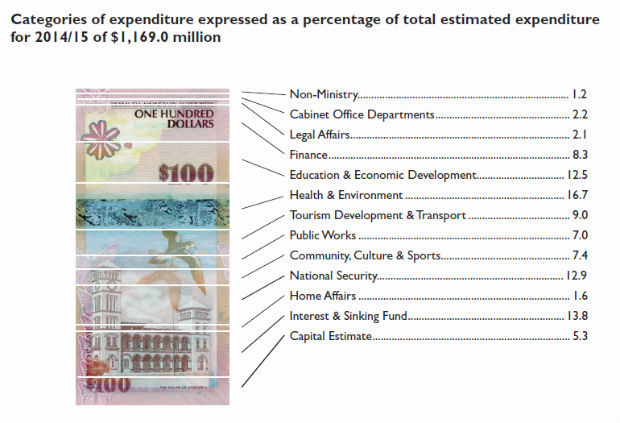
payroll tax 36%!!
Those dollar bill charts are the worst and Govt keeps using them year after year. They show the same data as the pie charts but as a percentage. Just put the % numbers next to the figures with the pie chart.
Complain to government not us