New Charts, Timeline Added To Covid Stats Page
As the island continues to deal with the Covid-19 pandemic, Bernews has updated its Bermuda Covid-19 statistics page on our dedicated Bermuda Covid-19 website with additional charts in an effort to provide more comprehensive information.
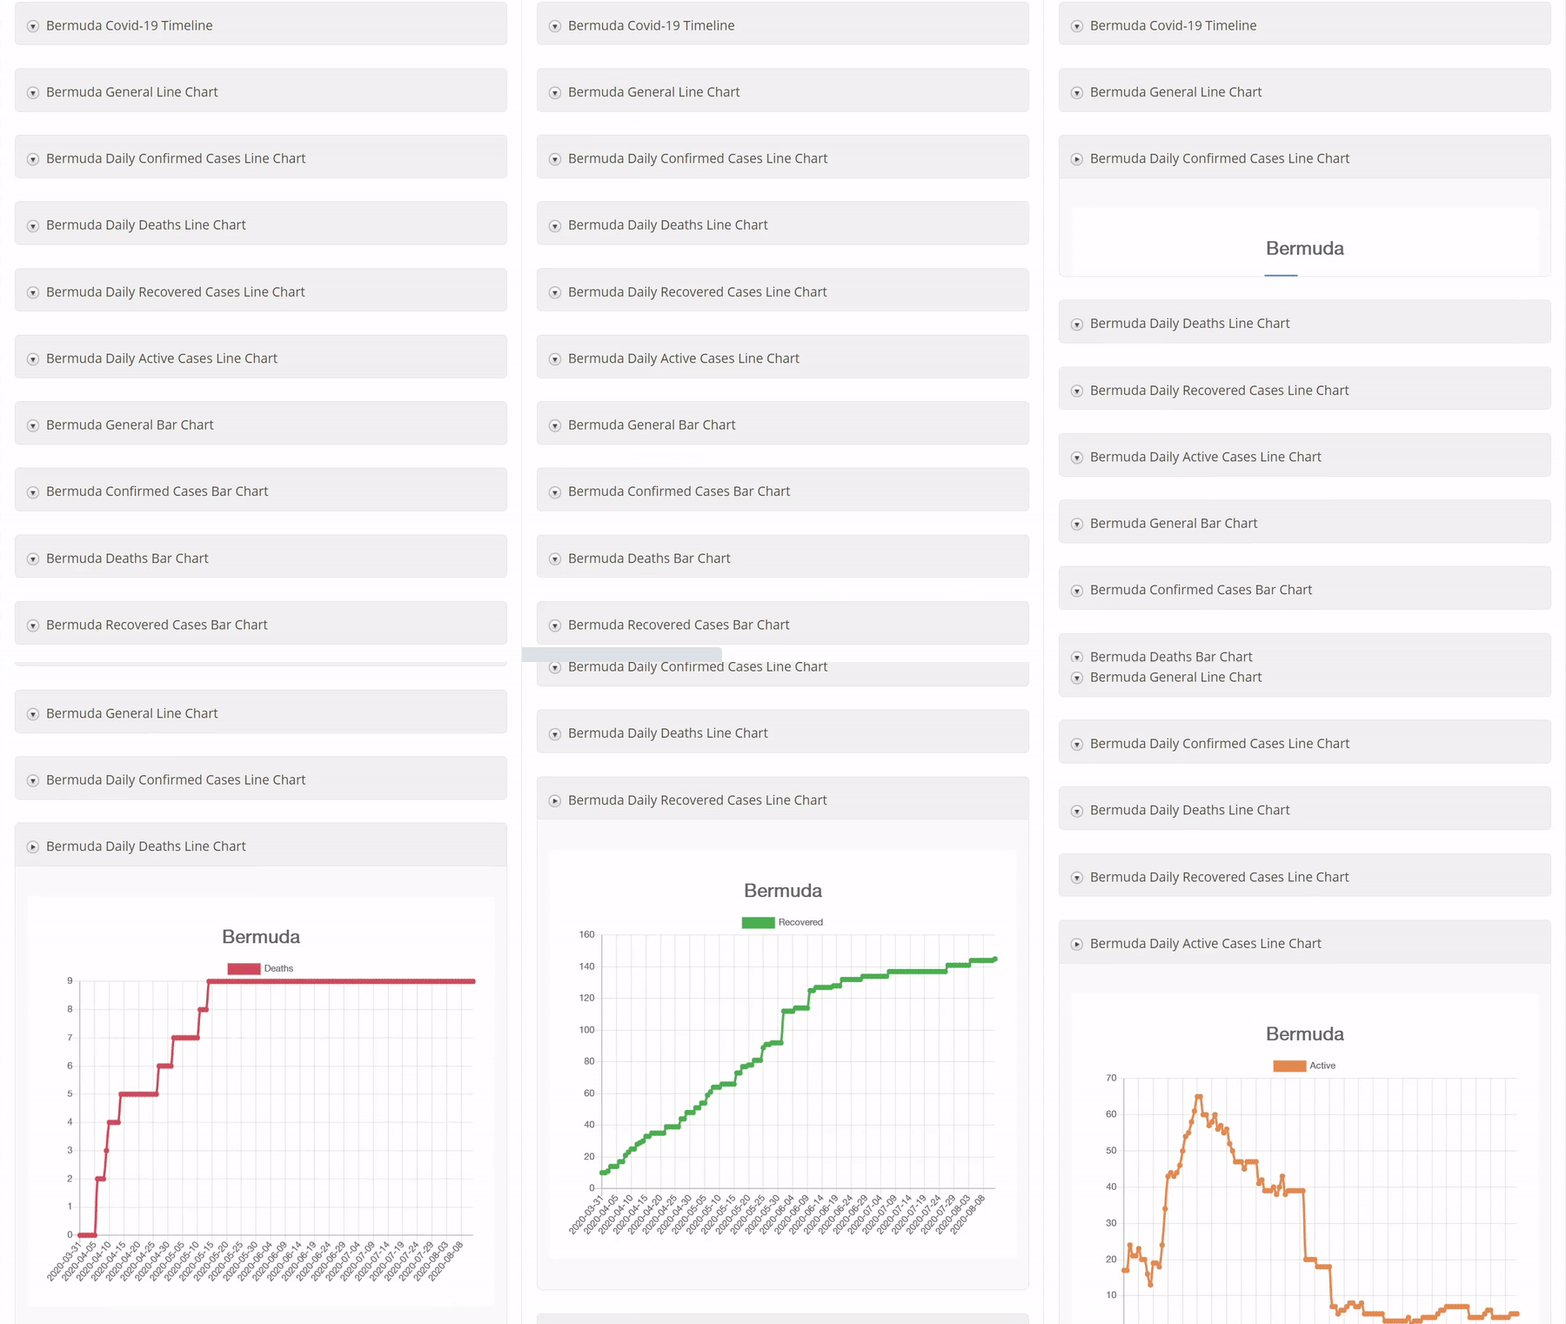
In addition to providing the near daily updates from the Government dating back to March, the page now includes 13 highly detailed charts that break down all of Bermuda’s Covid-19 data in a comprehensive manner. Some of the charts repeat data in different forms
Adding to this data is a full local timeline – updated daily – dating back to March that allows readers to see the progress of the virus’ spread in Bermuda, and by combining the Government updates, detailed charts, and full local timeline, it provides a comprehensive source for local Covid-19 data.
The Covid-19 website includes over 1,000 pages to date, and also offers a timeline, global statistics and more.
A short gif showing some of the charts available on the newly updated page:
As the island and world deals with the Covid-19 pandemic, we are doing our best to provide timely and accurate information, and you can find more information on the links below.
- All: Our coverage of the Covid-19 pandemic here
- Official: The Bermuda Government website here
- World Stats: Live graph of all cases worldwide here
- Bermuda Stats: Chart of the Bermuda stats here
- Timeline: Visual look at the timeline here
- Comprehensive: Our new Covid-19 website here
Read More About
Category: All, News, technology


Why persons have get 4 test fe usa b only 2 from England